— QuantX Desktop
Your edge.
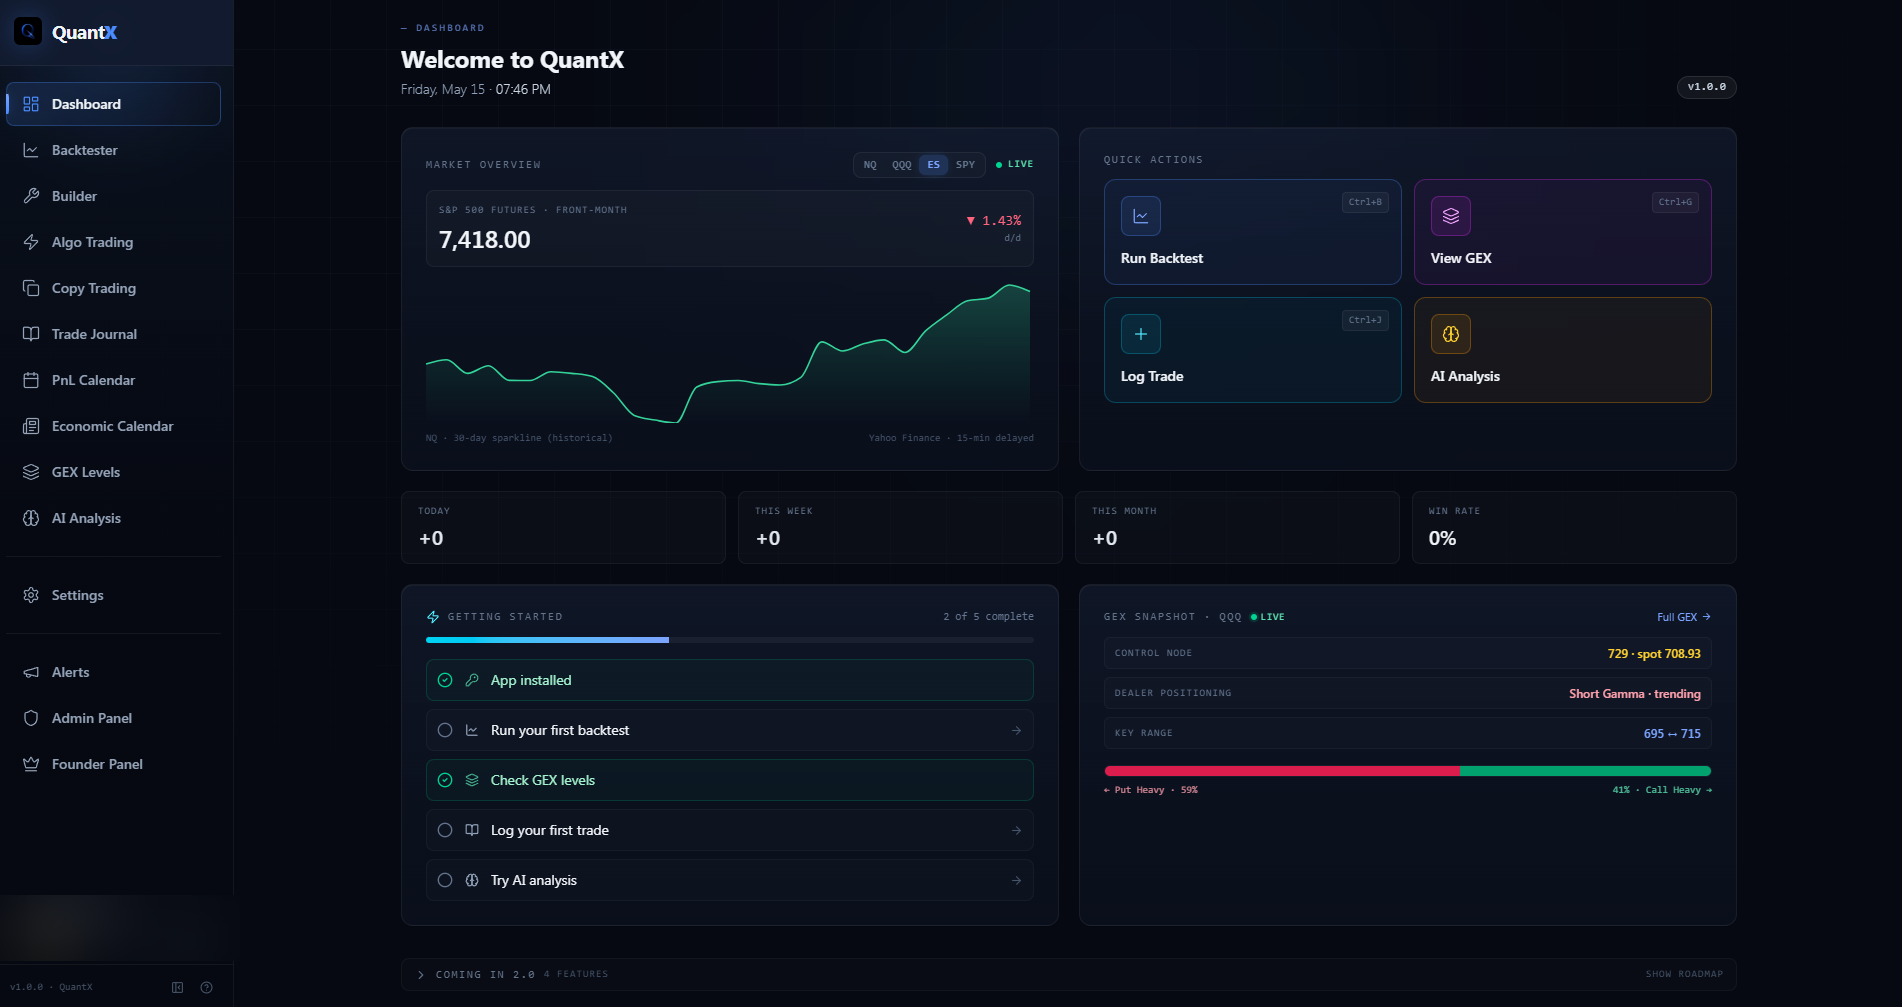
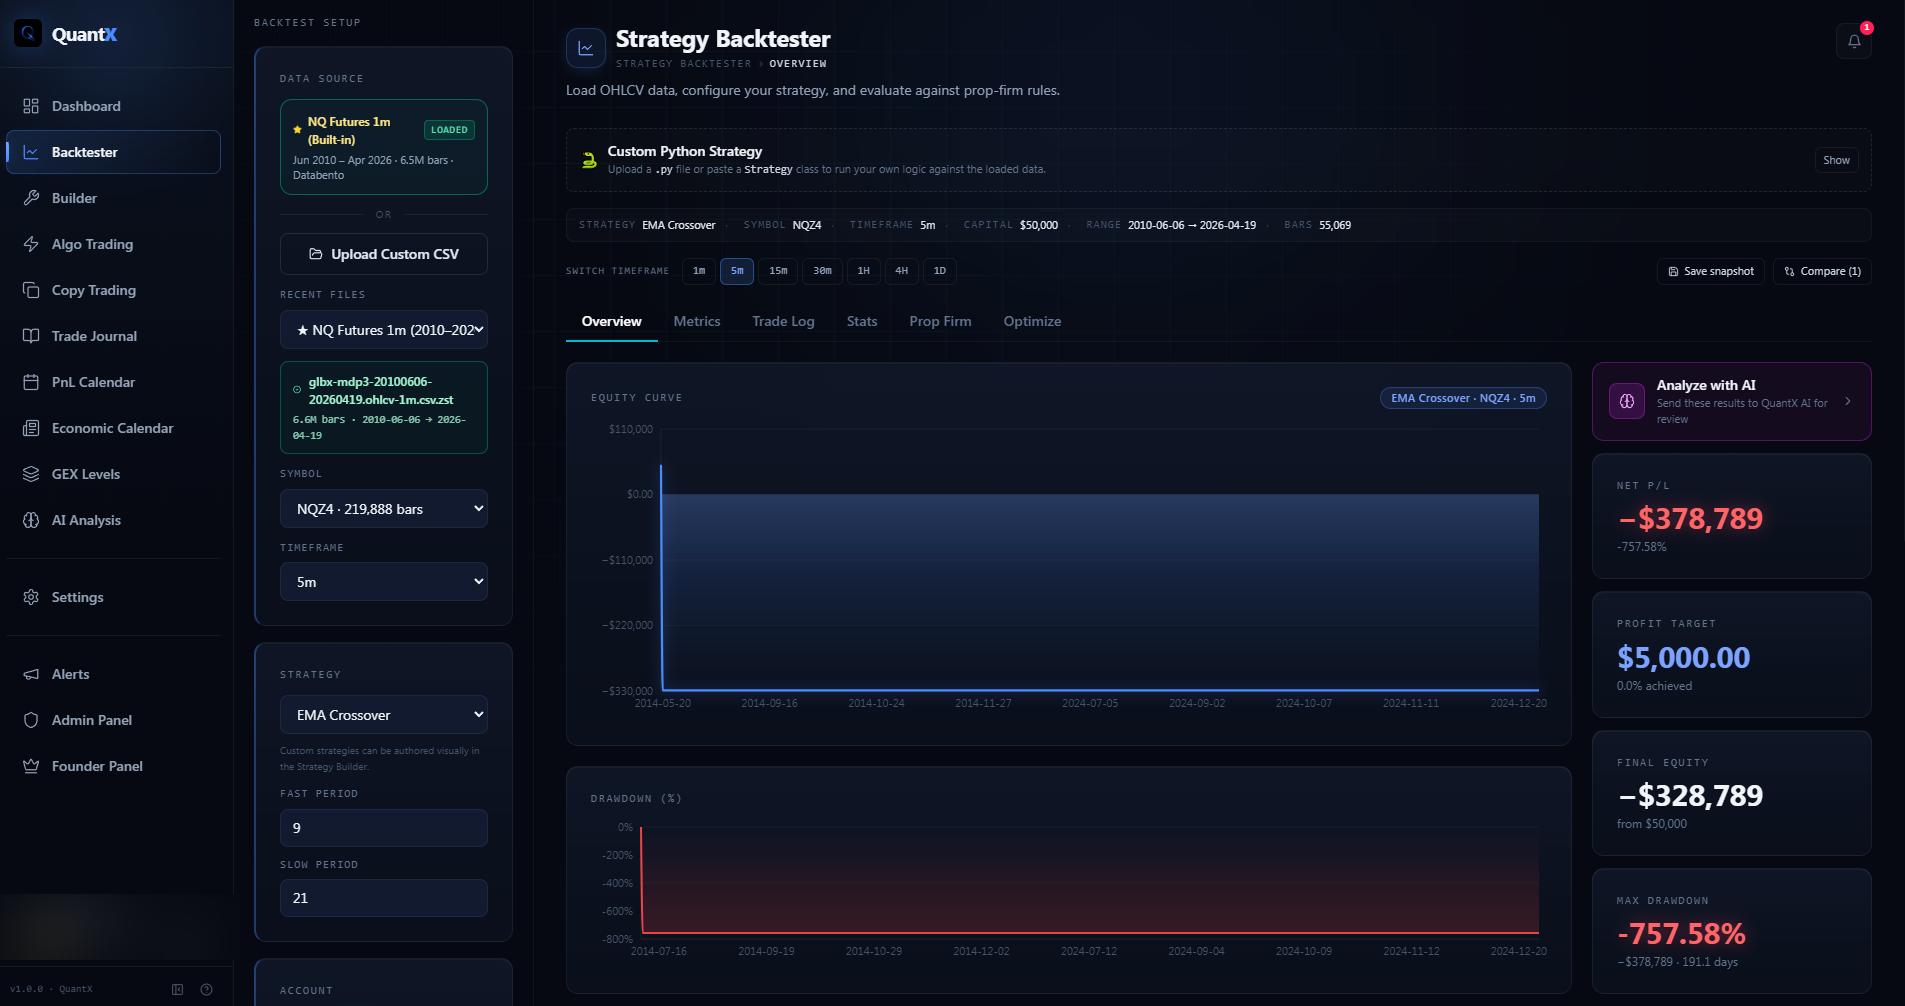
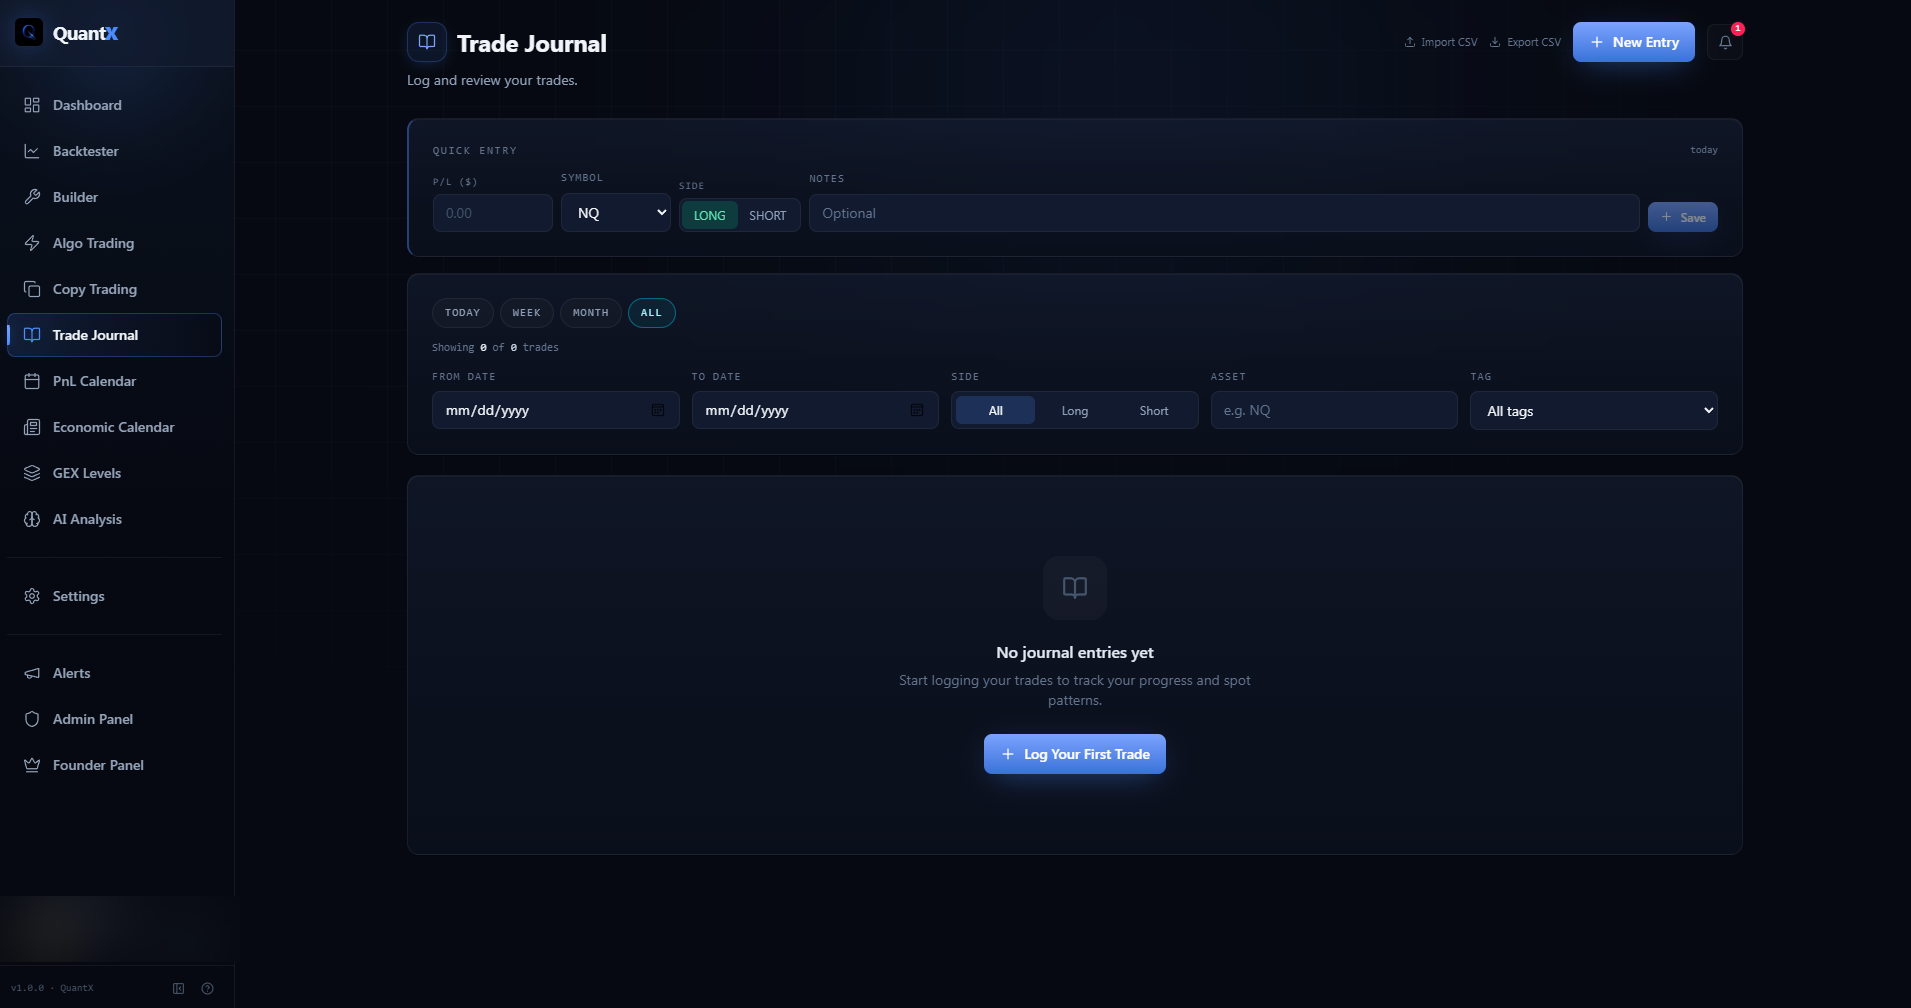
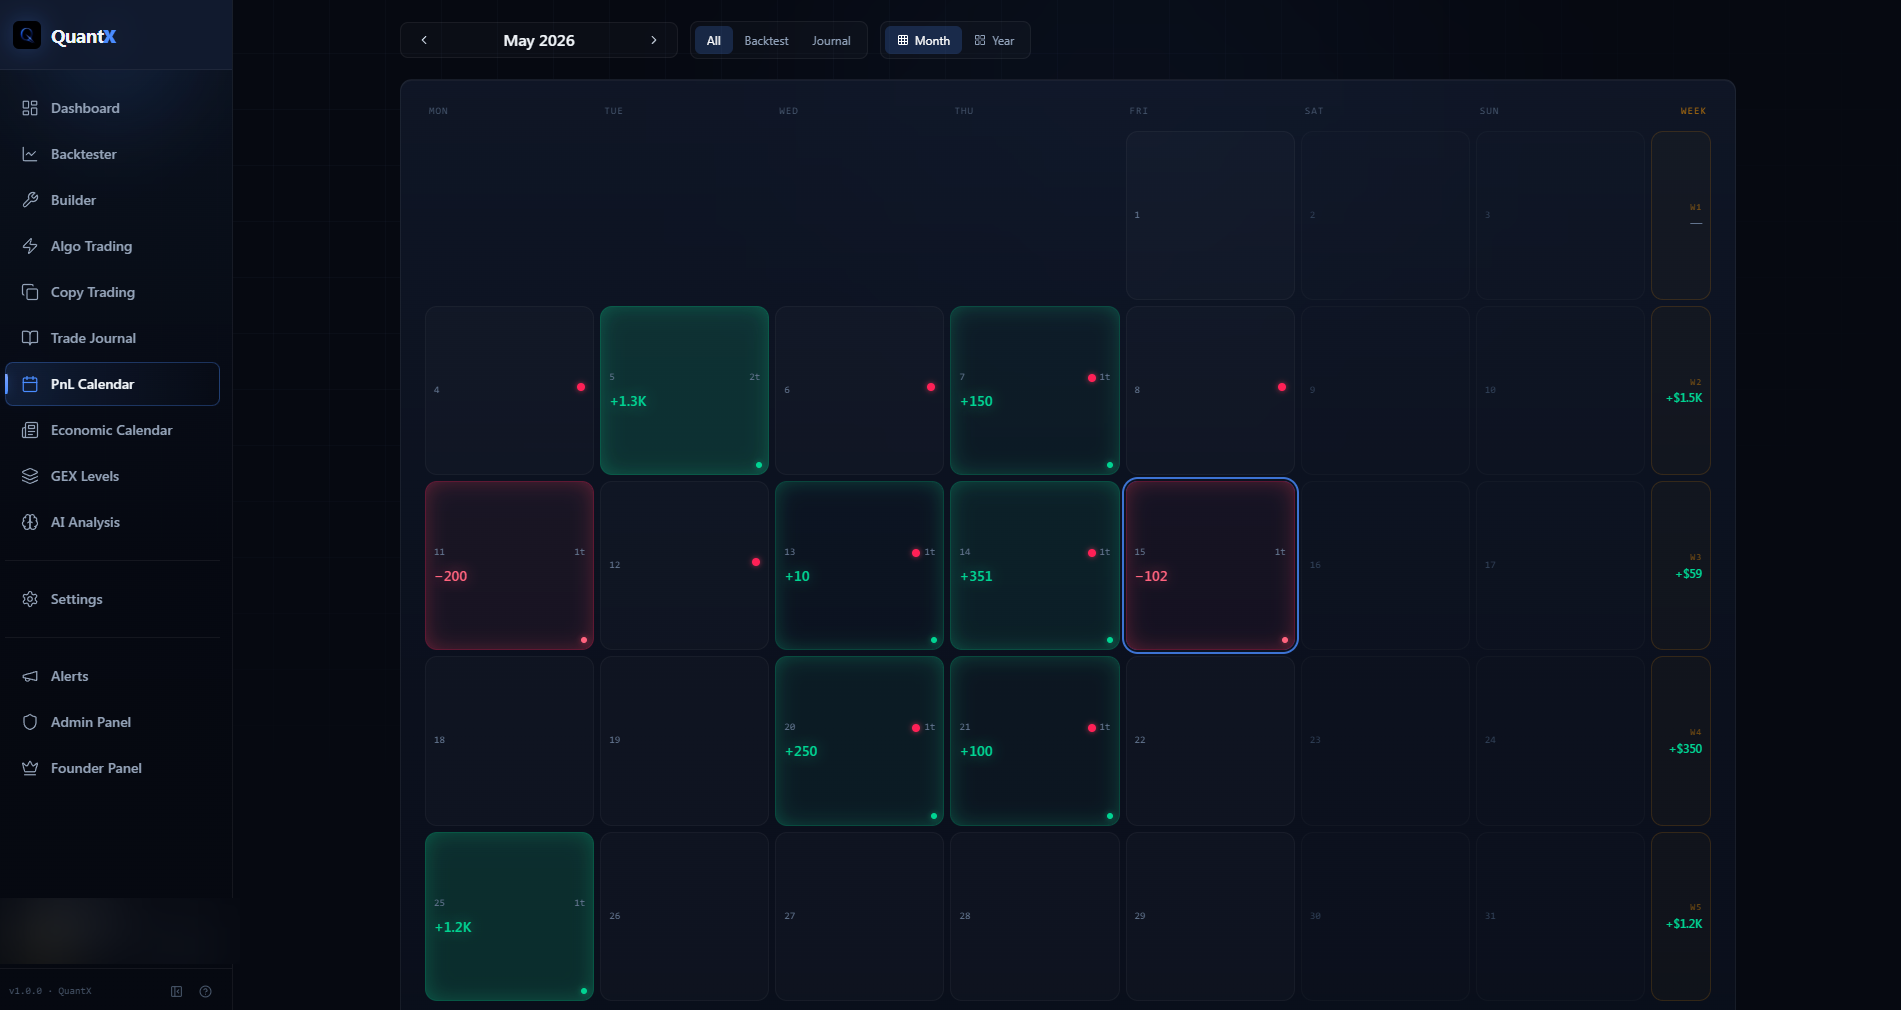
One app. Everything you need.
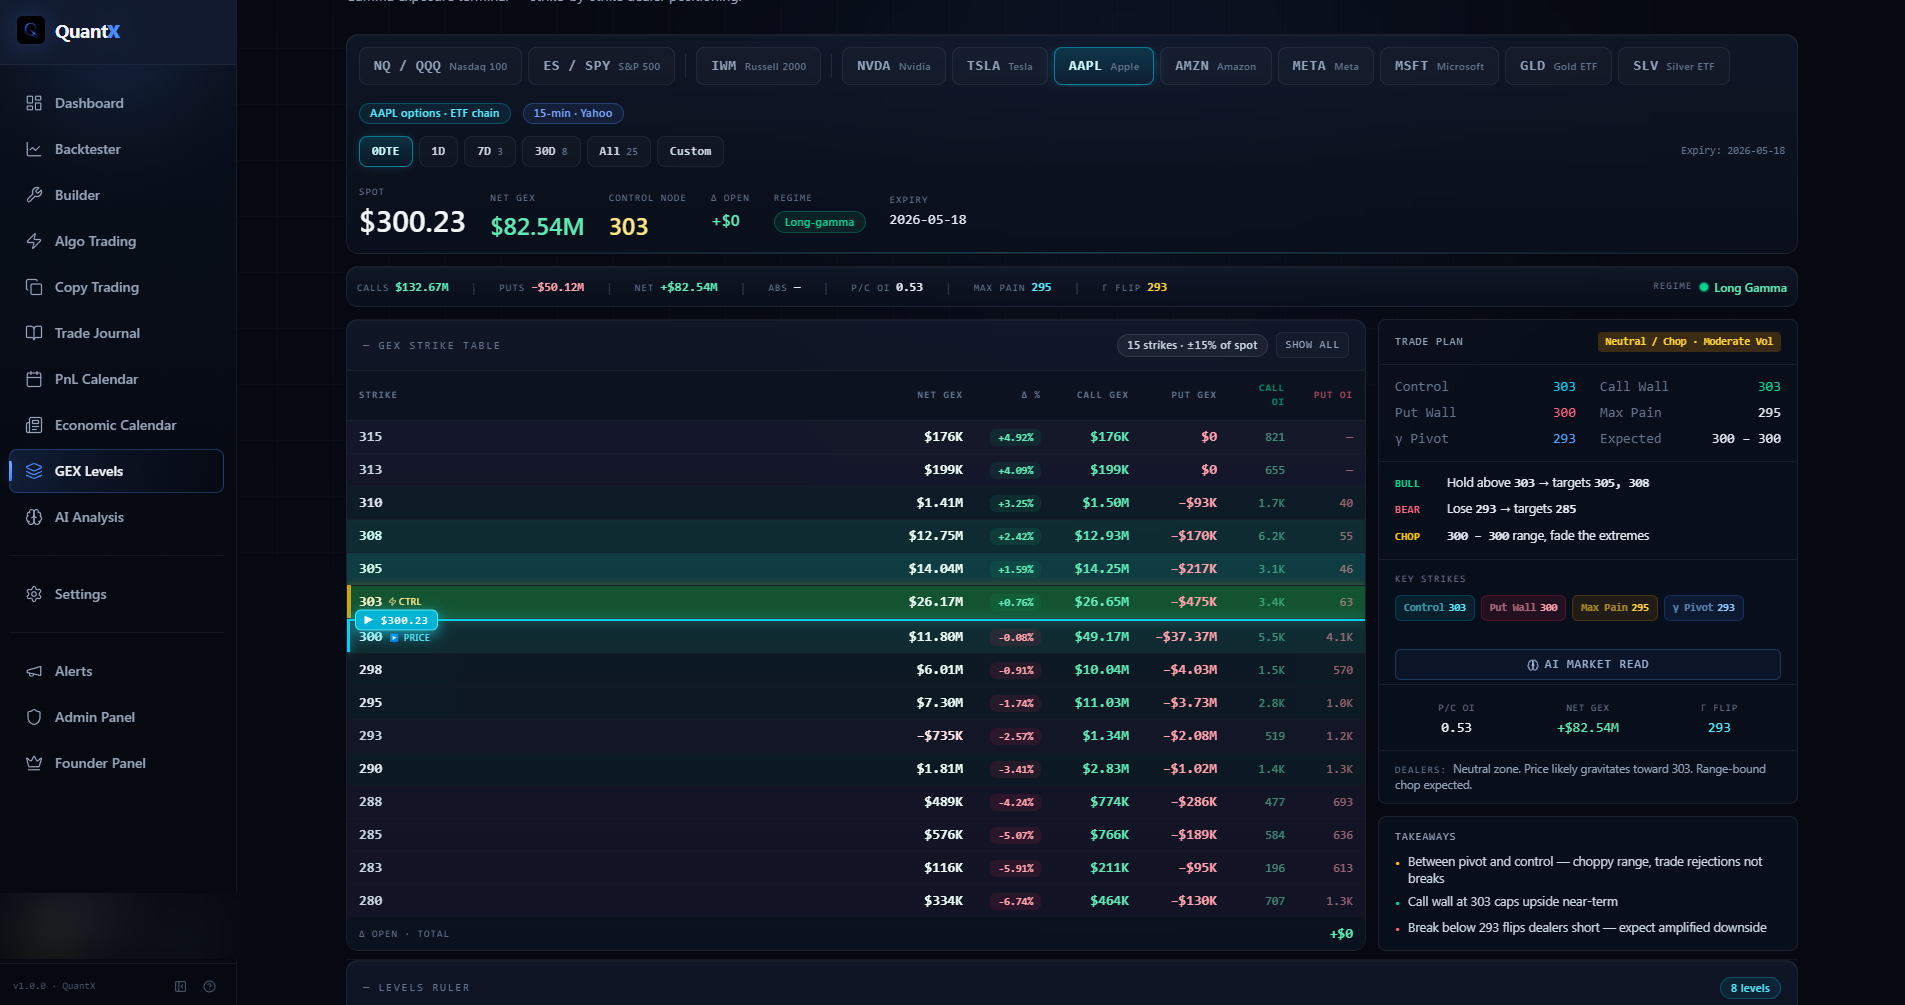
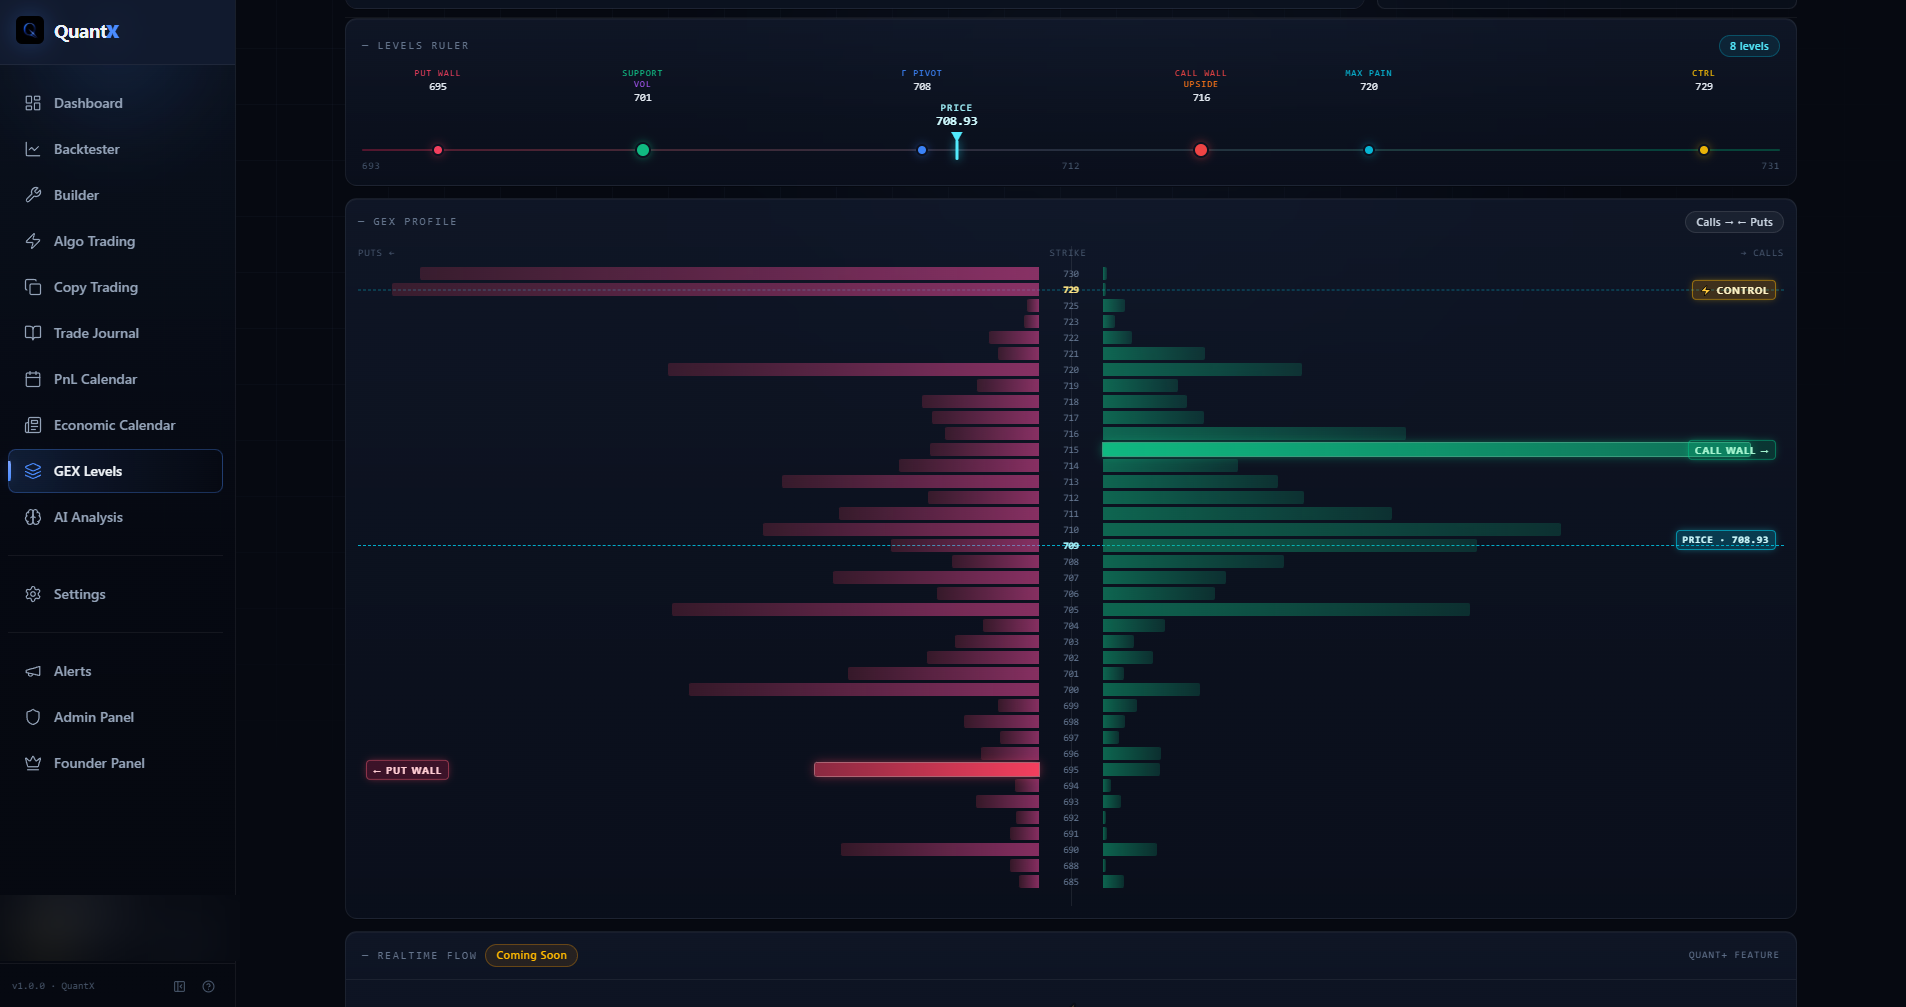
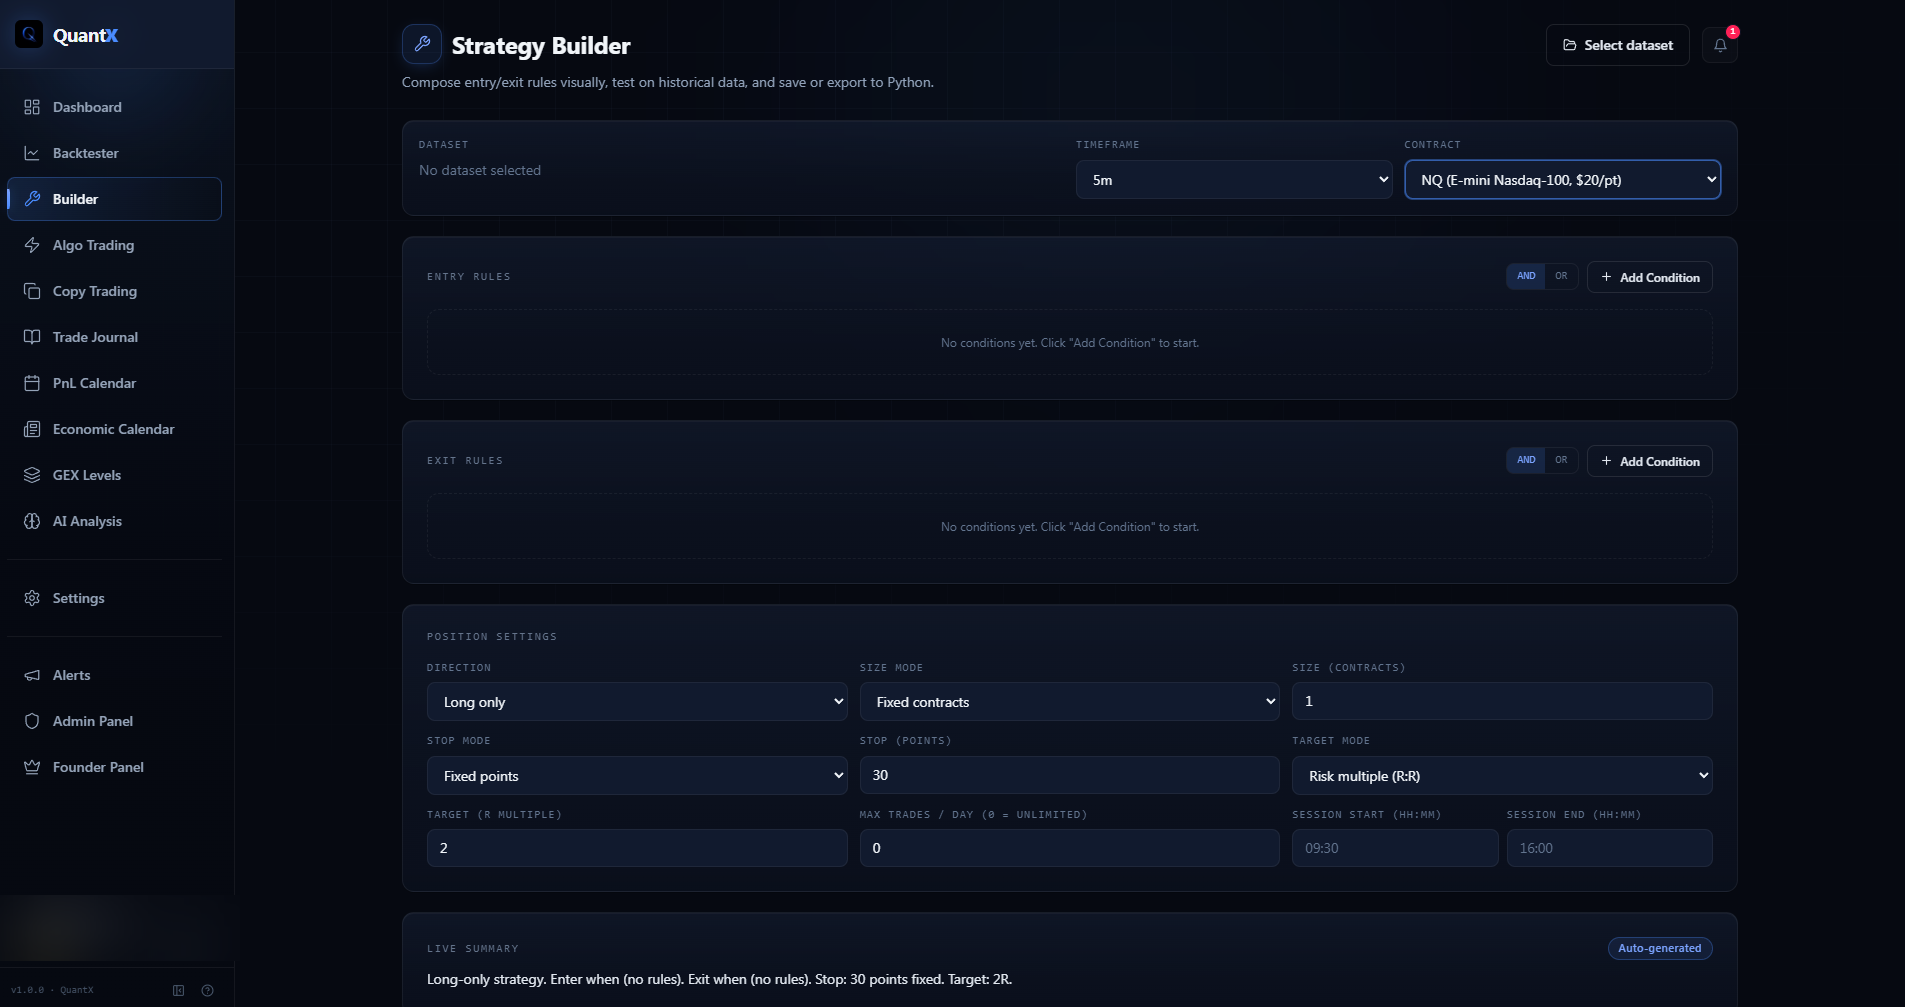
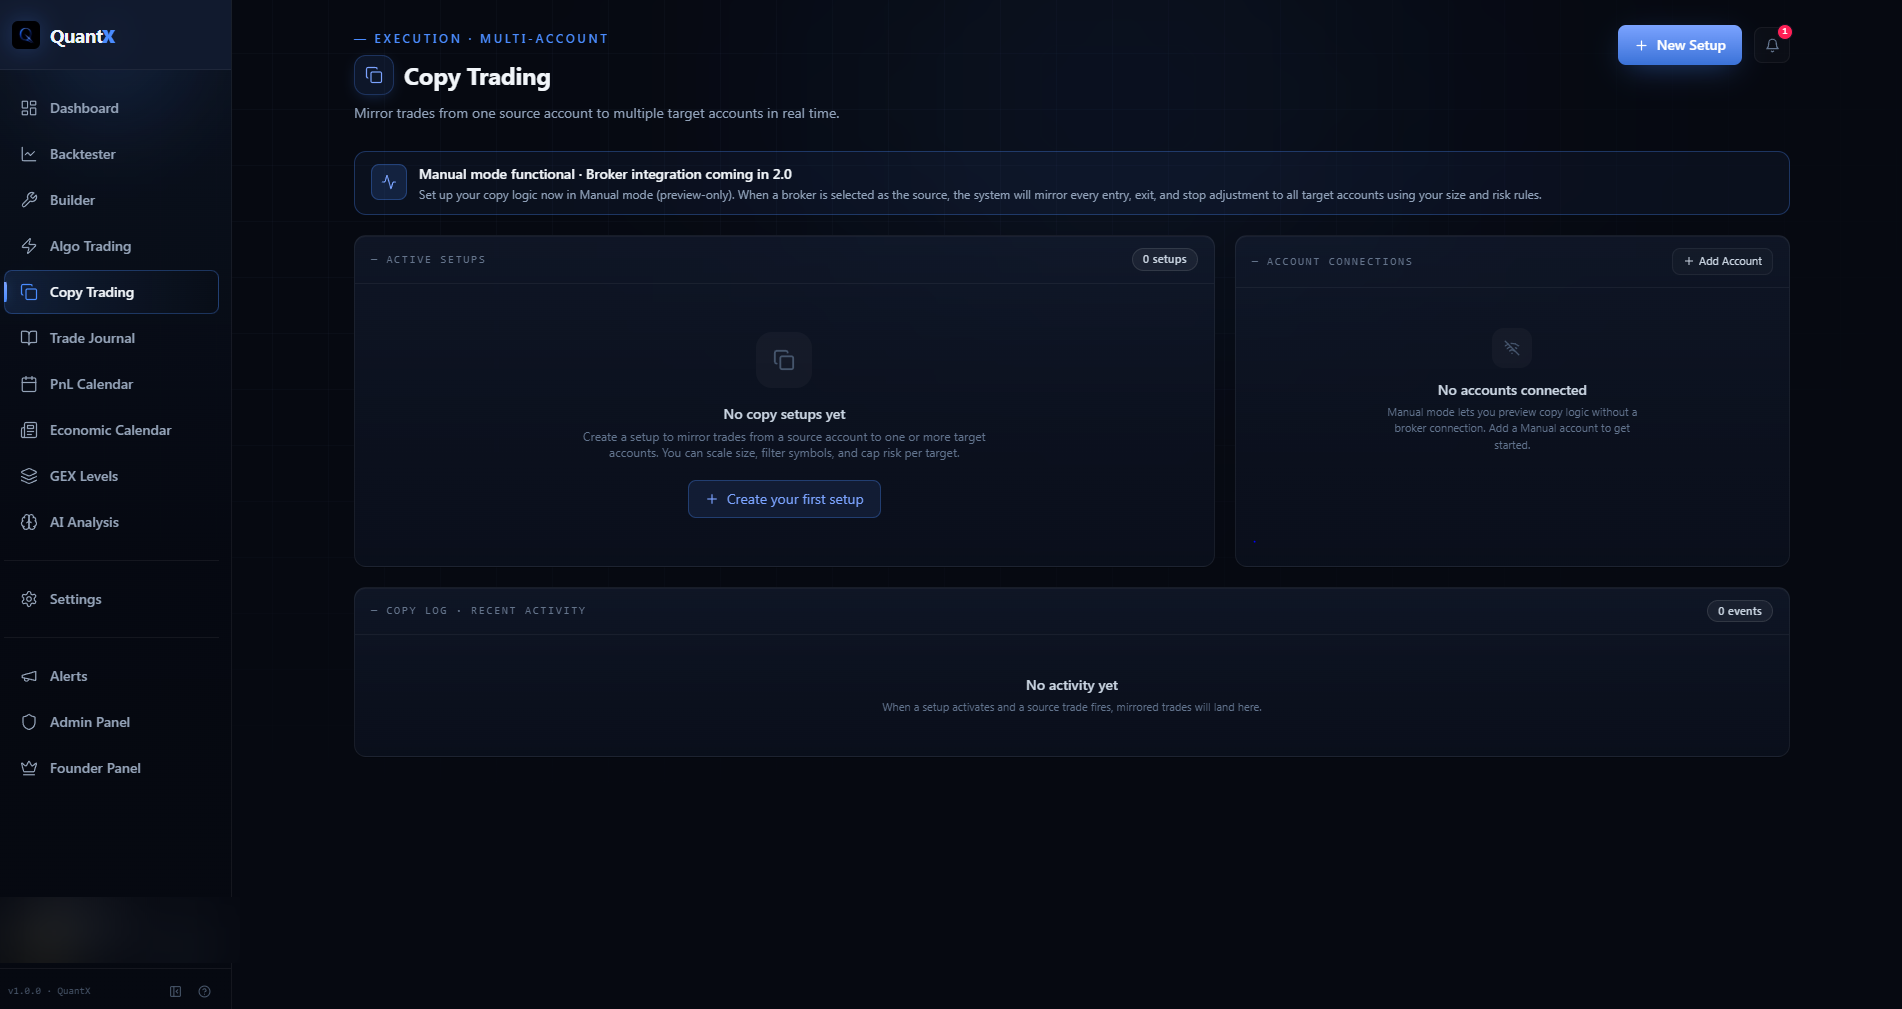
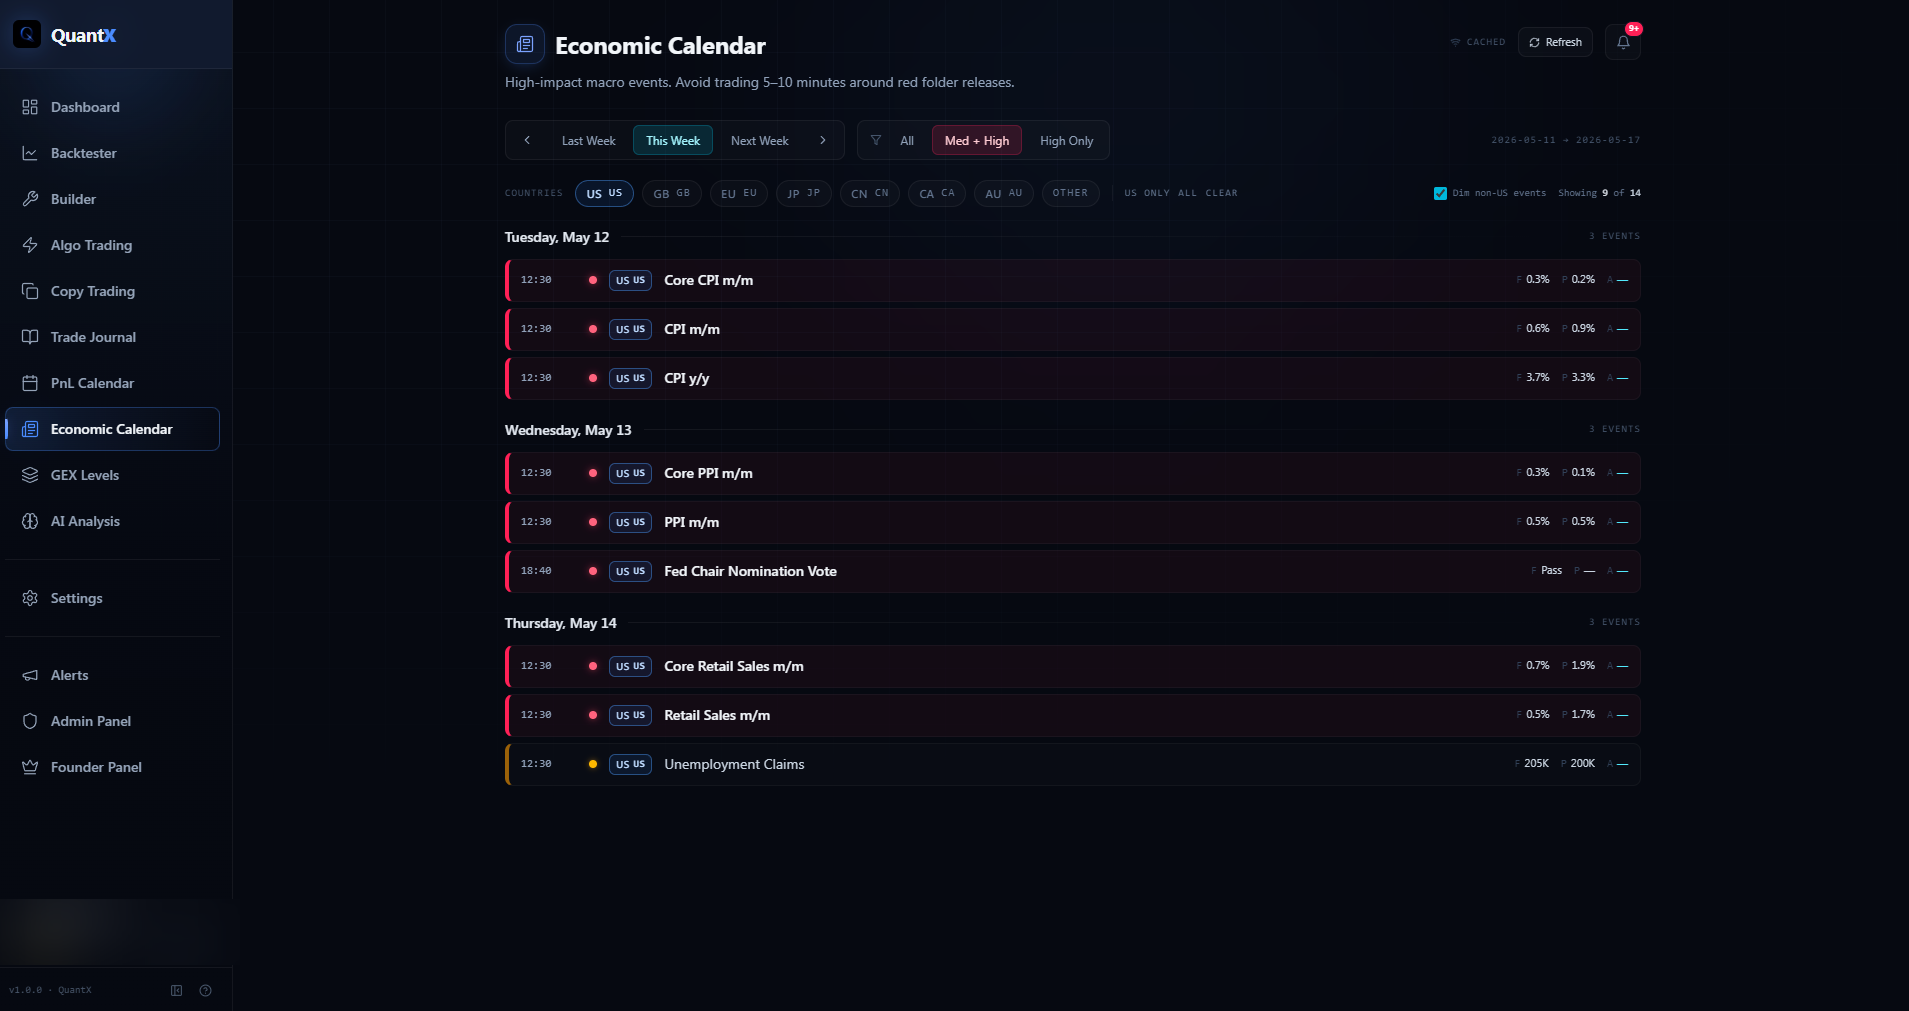
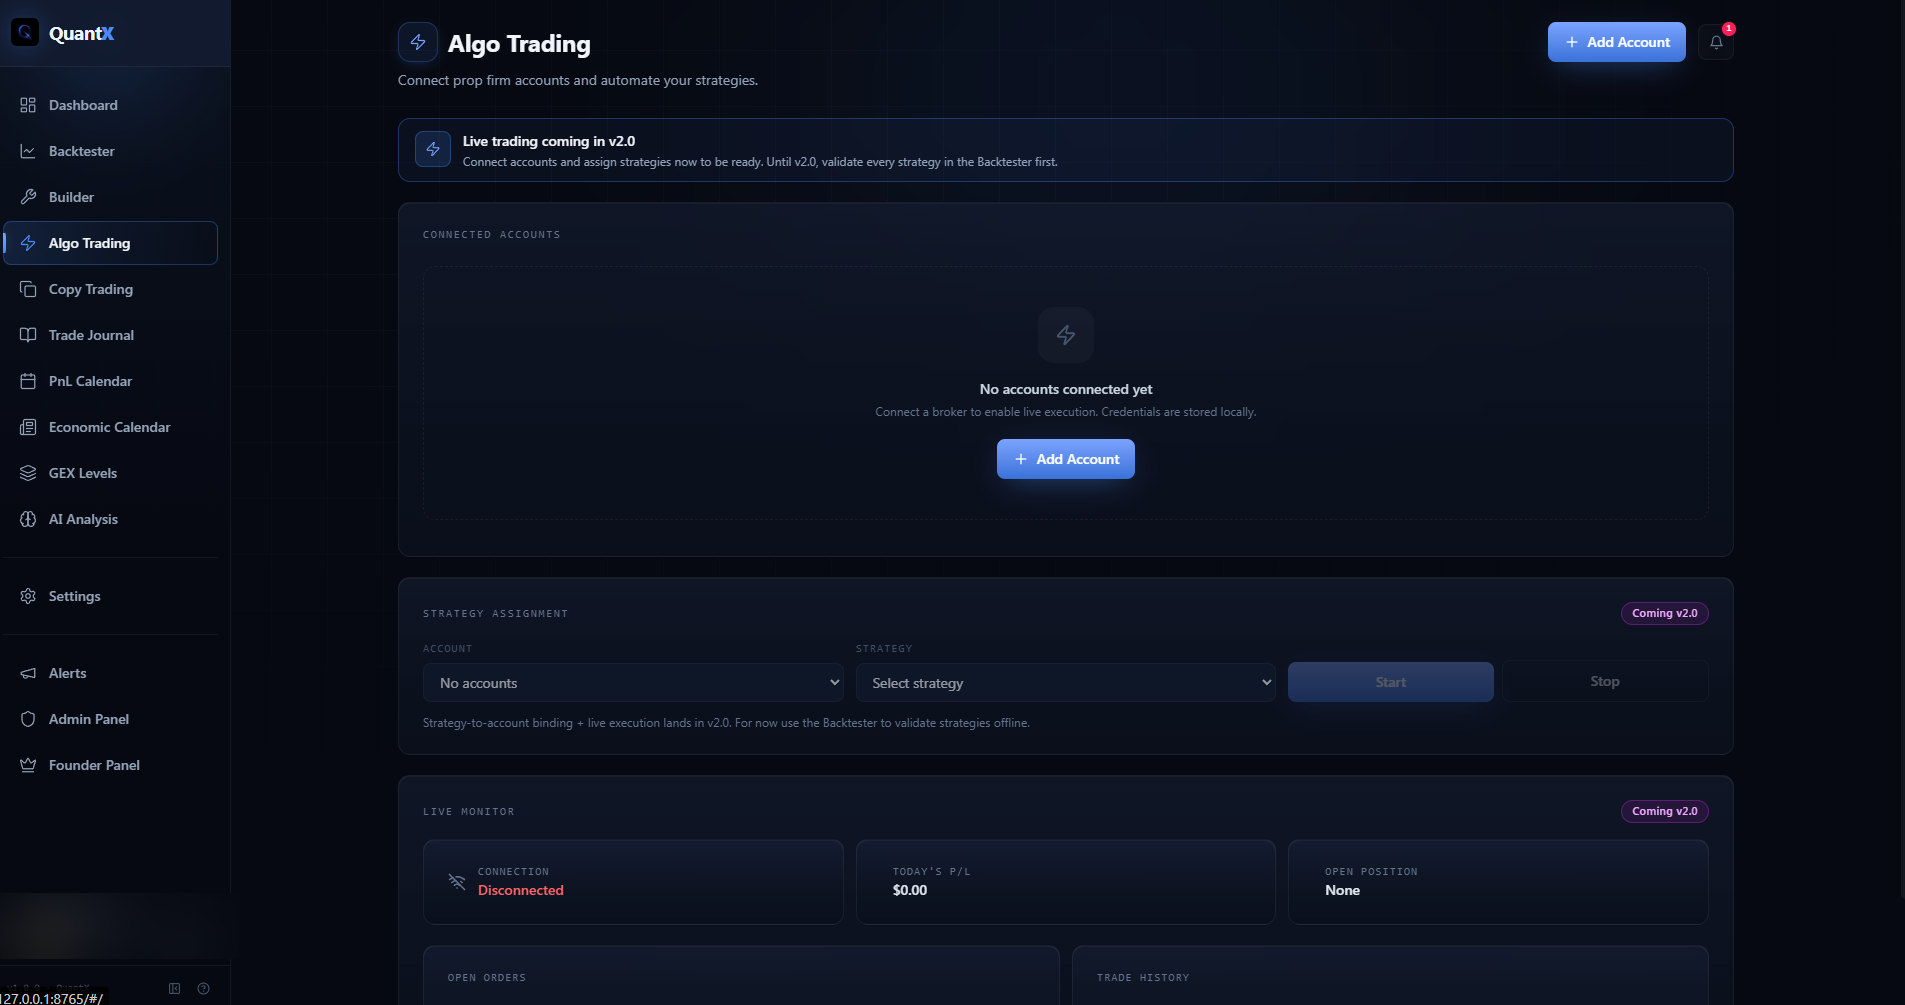
Backtest strategies, journal trades, analyze options flow, optimize with AI — all from your desktop. No cloud dependency. Your data stays yours.
QuantX